₹ 1,30,127 crore gross GST revenue collected in October
Revenues for the month of October 2021 are 24% higher than the GST revenues in the same month last year and 36% over 2019-20
The gross GST revenue collected in the month of October 2021 is ₹ 1,30,127 crore of which CGST is ₹ 23,861 crore, SGST is ₹ 30,421 crore, IGST is ₹ 67,361 crore (including ₹ 32,998 crore collected on import of goods) and Cess is ₹ 8,484 crore (including ₹ 699 crore collected on import of goods).
The government has settled ₹27,310 crore to CGST and ₹ 22,394 crore to SGST from IGST as regular settlement. The total revenue of Centre and the States after regular settlements in the month of October 2021 is ₹ 51171 crore for CGST and ₹ 52,815 crore for the SGST.
The revenues for the month of October 2021 are 24% higher than the GST revenues in the same month last year and 36% over 2019-20. During the month, revenues from import of goods was 39% higher and the revenues from domestic transaction (including import of services) are 19% higher than the revenues from these sources during the same month last year.
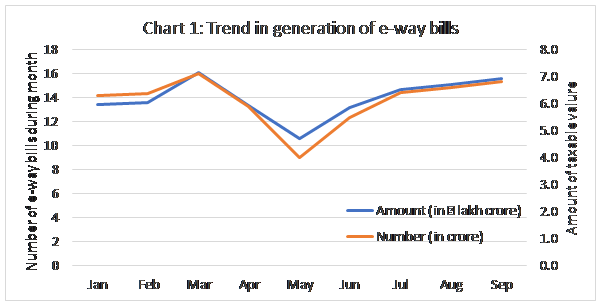
The GST revenues for October have been the second highest ever since introduction of GST, second only to that in April 2021, which related to year-end revenues. This is very much in line with the trend in economic recovery. This is also evident from the trend in the e-way bills generated every month since the second wave. The revenues would have still been higher if the sales of cars and other products had not been affected on account of disruption in supply of semi-conductors. Chart 1 shows the upward trend in number of e-way bills generated during the month and the amount of taxable value clearly indicating the recovery in economic activity.
The revenues have also been aided due to the efforts of the State and Central tax administration resulting in increased compliance over previous months. In addition to action against individual tax evaders, this has been a result of the multipronged approach followed by the GST Council. On one hand, various measures have been taken to ease compliance like nil filing through SMS, enabling Quarterly Return Monthly Payment (QRMP) system and auto-
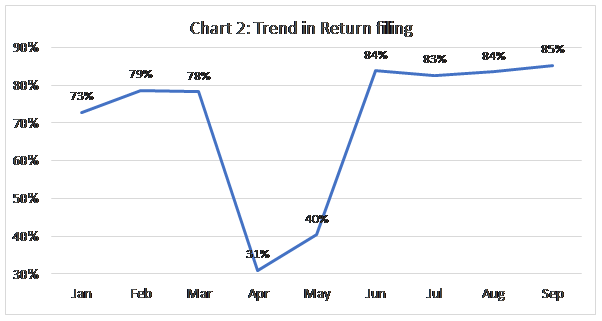
population of return. During past one year, GSTN has augmented the system capacity considerably to improve user experience. On the other hand, the Council has also taken various steps to discourage non-compliant behaviour, like blocking of e-way bills for non-filing of returns, system-based suspension of registration of taxpayers who have failed to file six returns in a row and blocking of credit for return defaulters. Number of returns (GSTR-3B) of every month/quarter by the end of next month is a good parameter indicating timely payment of returns and filing of returns. After last date of filing of returns, special efforts are undertaken to ensure compliance by the end of the month in form of messaging by GSTN and close follow up by the Centre and State tax administration. Chart 2 showing the upward trend in percentage of returns filed till the end of next month clearly indicates that timely payment of taxes has been increasing over a period of time due to policy measures and administrative efforts.
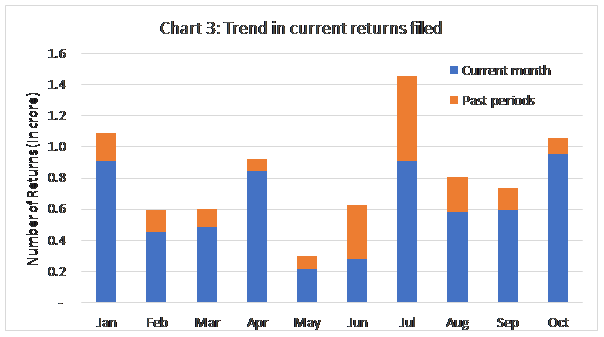
This has also been aided by the fact that at various occasions, Council decided to waive late fee allowing people to file old returns and come up-to-date in filing of returns. With more and more taxpayers filing the returns every month, the percentage of returns of old period filed in any month has been increasing continuously. Chart 3 shows the share of returns of the current period filed in every month out of the total returns filed, clearly indicating that the number of returns of the current month has increased considerably. 1.5 crore returns were filed in the month of July 2021 as taxpayers filed returns of past months taking benefit of the relaxation given due to Covid.
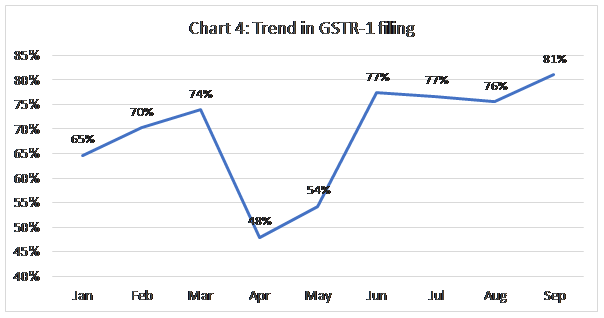
With improvement of return filing, the focus of GST Council has been on timely filing of GSTR-1, the statement containing details of invoices. This statement is critical to ensure discipline in taking input tax credit. Various steps have been taken to ensure timely filing of GSTR-1. Chart 4 displaying GSTR-1 filing by the end of the month shows that these steps have brought in the desired result as the percentage of GSTR-1 filed by the end of the month is clearly showing an upward trend.
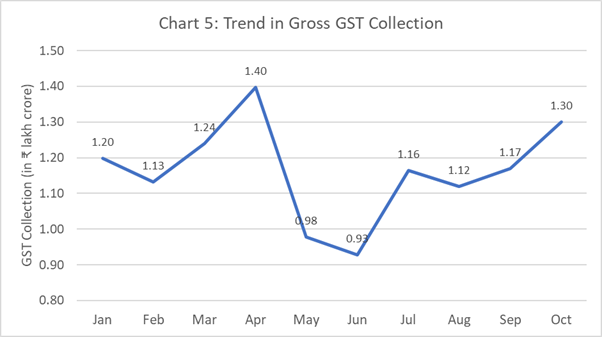
Overall, the impact of these efforts has ensured increased compliance and higher revenues. As a part of overall efforts to plug evasion, more steps to restrict fake ITC are under consideration of the GST Council. Chart 5 below shows the trend in monthly GST revenues during the year and the table shows the state-wise breakup of GST revenues (excluding GST on import of goods). There is a small difference between the monthly figures shown in the chart below for the months of May and Jun and those included in the respective press notes as the figures published then were till 5th of the next month as the taxpayers were given relief in filing of returns till 5th of the next month due to the pandemic.
State-wise growth of GST Revenues during October 2021[1]
State | Oct-20 | Oct-21 | Growth |
Jammu and Kashmir | 377 | 648 | 72% |
Himachal Pradesh | 691 | 689 | 0% |
Punjab | 1,376 | 1,595 | 16% |
Chandigarh | 152 | 158 | 4% |
Uttarakhand | 1,272 | 1,259 | -1% |
Haryana | 5,433 | 5,606 | 3% |
Delhi | 3,211 | 4,045 | 26% |
Rajasthan | 2,966 | 3,423 | 15% |
Uttar Pradesh | 5,471 | 6,775 | 24% |
Bihar | 1,010 | 1,351 | 34% |
Sikkim | 177 | 257 | 45% |
Arunachal Pradesh | 98 | 47 | -52% |
Nagaland | 30 | 38 | 30% |
Manipur | 43 | 64 | 49% |
Mizoram | 32 | 32 | 1% |
Tripura | 57 | 67 | 17% |
Meghalaya | 117 | 140 | 19% |
Assam | 1,017 | 1,425 | 40% |
West Bengal | 3,738 | 4,259 | 14% |
Jharkhand | 1,771 | 2,370 | 34% |
Odisha | 2,419 | 3,593 | 49% |
Chhattisgarh | 1,974 | 2,392 | 21% |
Madhya Pradesh | 2,403 | 2,666 | 11% |
Gujarat | 6,787 | 8,497 | 25% |
Daman and Diu | 7 | 0 | -99% |
Dadra and Nagar Haveli | 283 | 269 | -5% |
Maharashtra | 15,799 | 19,355 | 23% |
Karnataka | 6,998 | 8,259 | 18% |
Goa | 310 | 317 | 3% |
Lakshadweep | 1 | 2 | 86% |
Kerala | 1,665 | 1,932 | 16% |
Tamil Nadu | 6,901 | 7,642 | 11% |
Puducherry | 161 | 152 | -6% |
Andaman and Nicobar Islands | 19 | 26 | 40% |
Telangana | 3,383 | 3,854 | 14% |
Andhra Pradesh | 2,480 | 2,879 | 16% |
Ladakh | 15 | 19 | 32% |
Other Territory | 91 | 137 | 51% |
Centre Jurisdiction | 114 | 189 | 66% |
Grand Total | 80,848 | 96,430 | 19% |
********
